
Chapter 2
OVERVIEW OF THE PROGRAM
2.1 General Features
VESTA [11, 12, 13, 14] is a 3D visualization system for structural models, volumetric data (“voxel” data), and crystal morphologies. A variety of physical quantities such as electron densities, densities of coherent-scattering lengths \(\bm {b}_c\) (nuclear densities) [10], wave functions, and electrostatic potentials can be superimposed on atomistic structures and external morphology of crystals. Objects (atoms, bonds, coordination polyhedra, isosurfaces, etc.) can be rotated, scaled, and translated fast in three dimensions, particularly in the presence of graphics cards supporting the OpenGL instruction set. The scalability of VESTA is very high; it enables us to deal with a practically unlimited numbers of objects such as atoms, bonds, polyhedra, and polygons on isosurfaces so long as memory capacity is enough. Drawing boundaries are defined by ranges along \(x\), \(y\), and \(z\) axes as well as lattice planes.
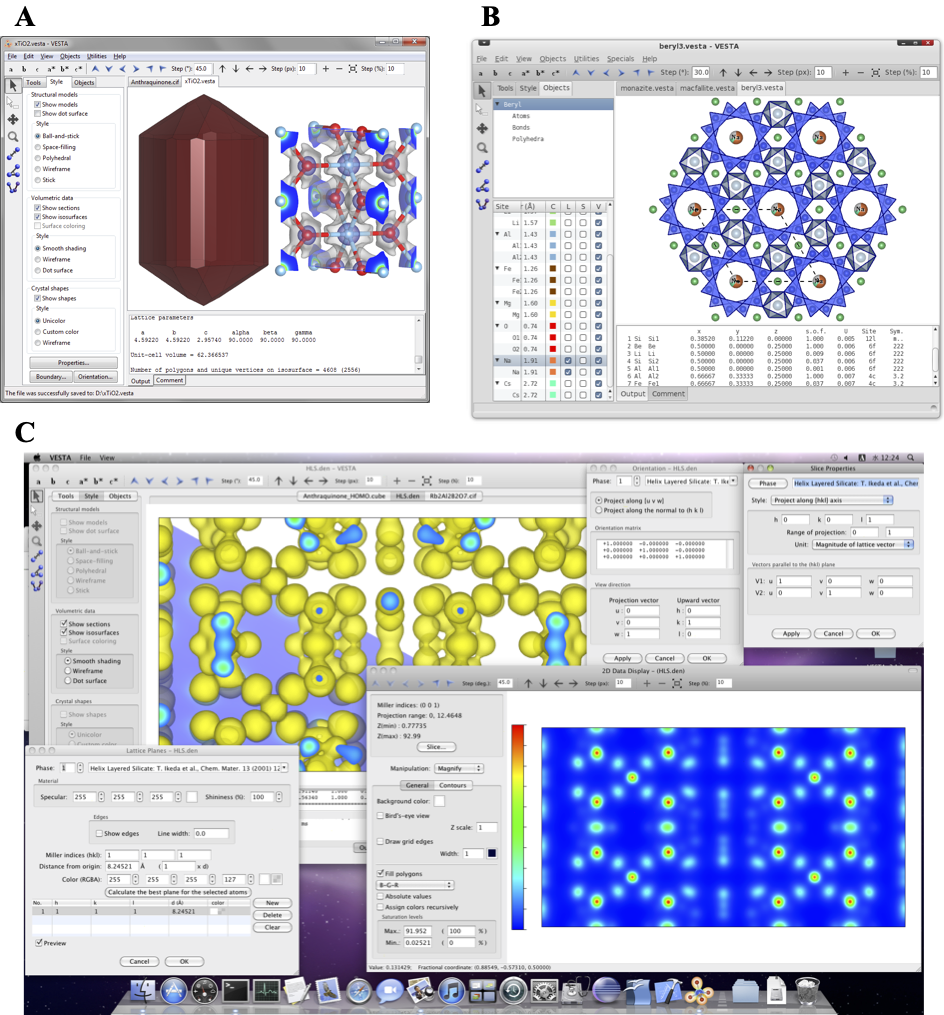
As Fig. 2.1 illustrates, VESTA runs on Microsoft Windows (hereafter referred to as Windows), macOS, and Linux. With VESTA, we can deal with multiple data in the same window, using a “tab” user interface. VESTA further supports multiple windows, each of which may contain multiple tabs corresponding to files.
2.2 Visualization of Structural Models
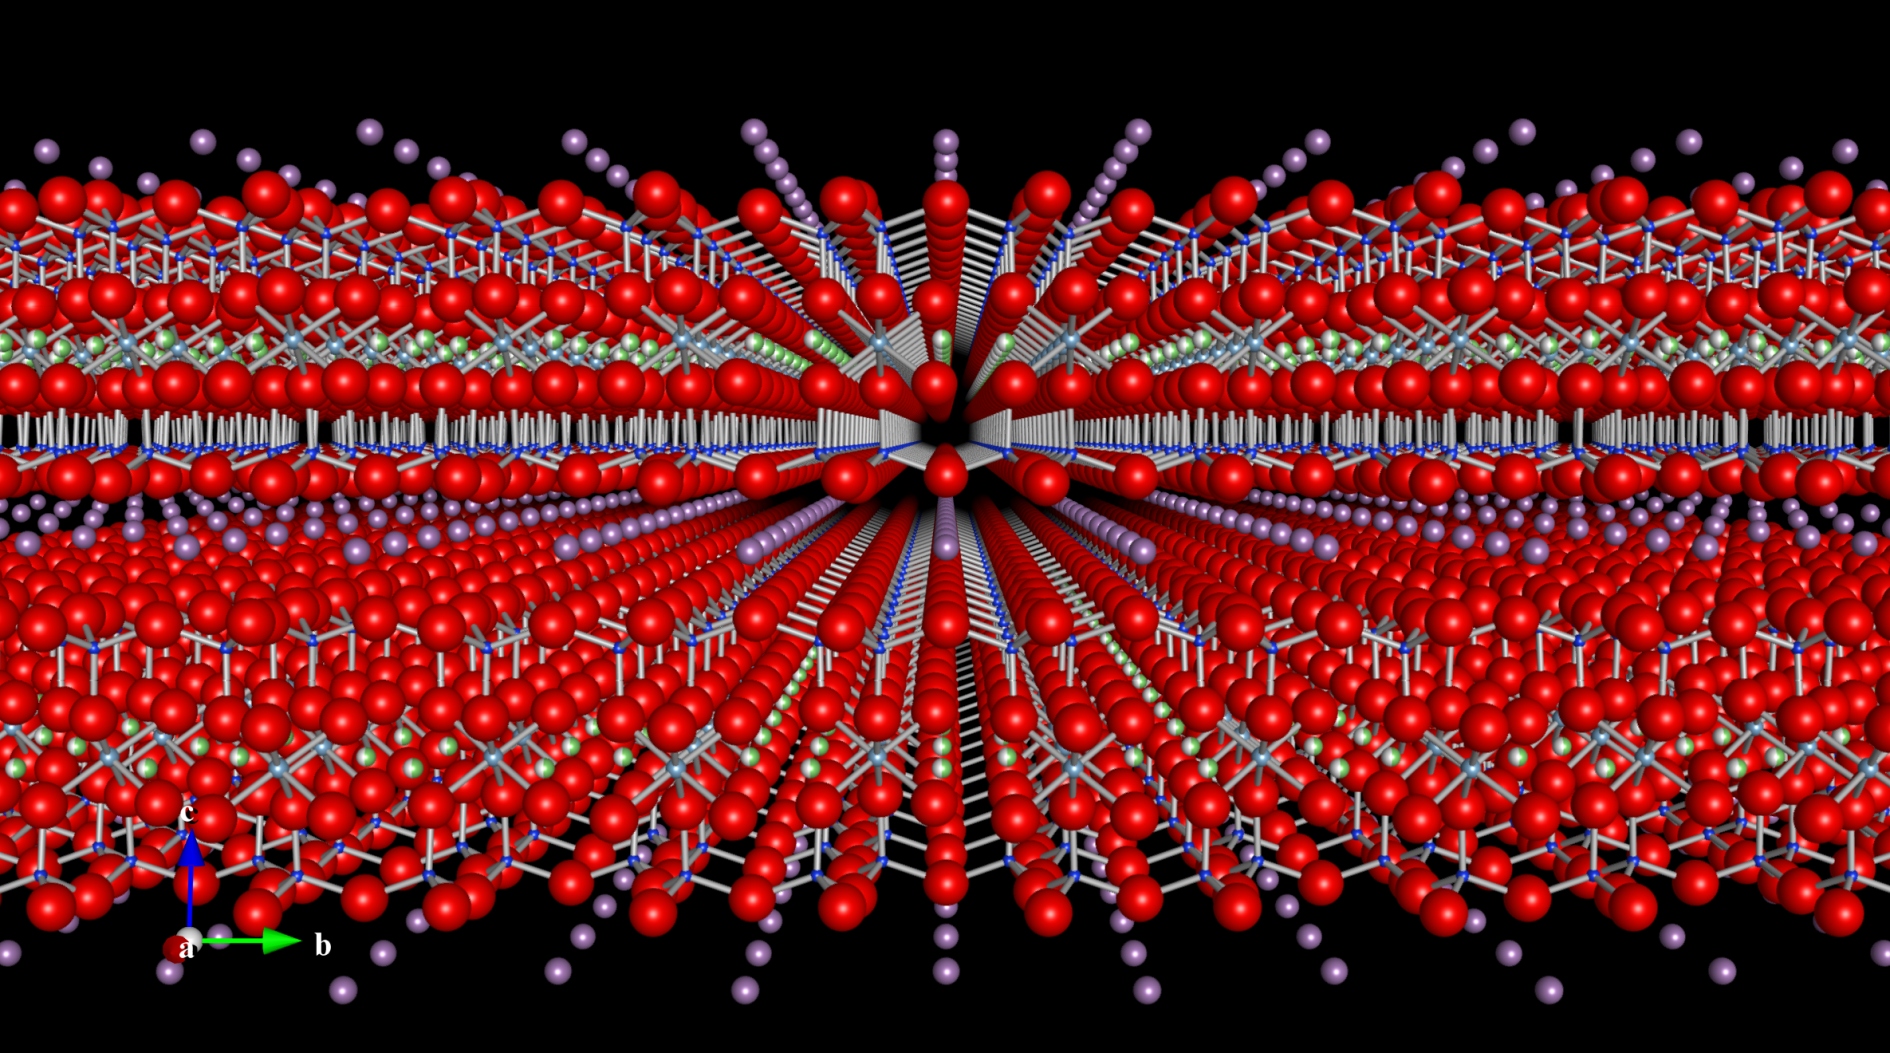
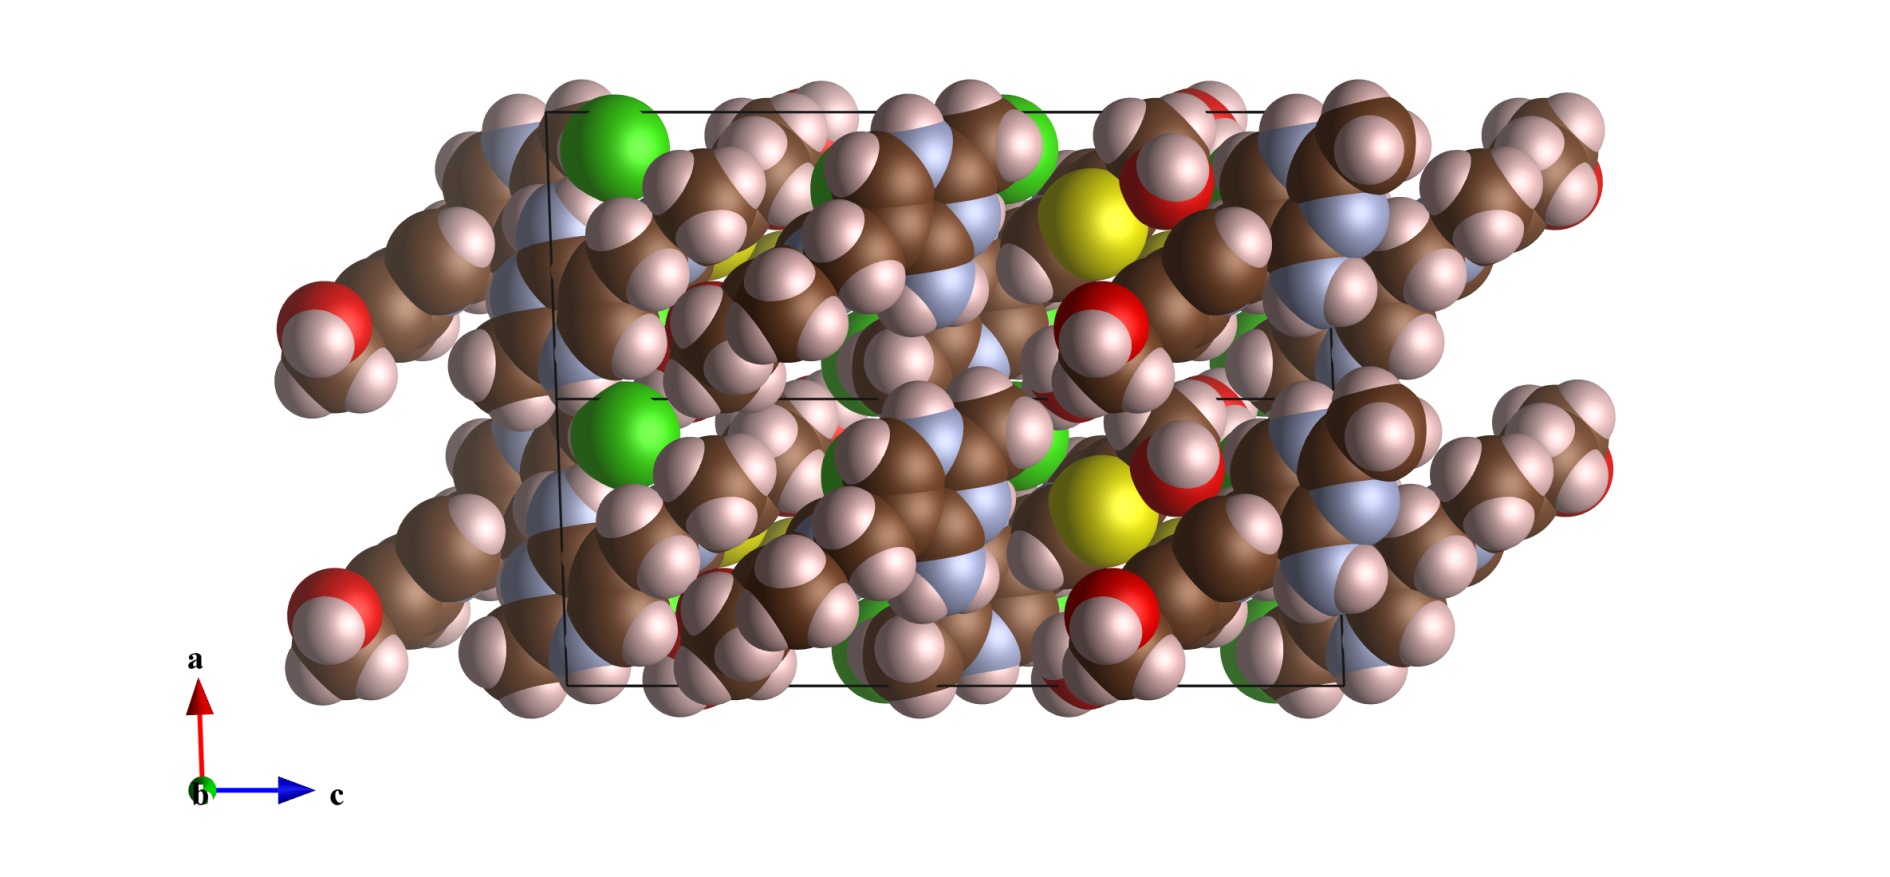
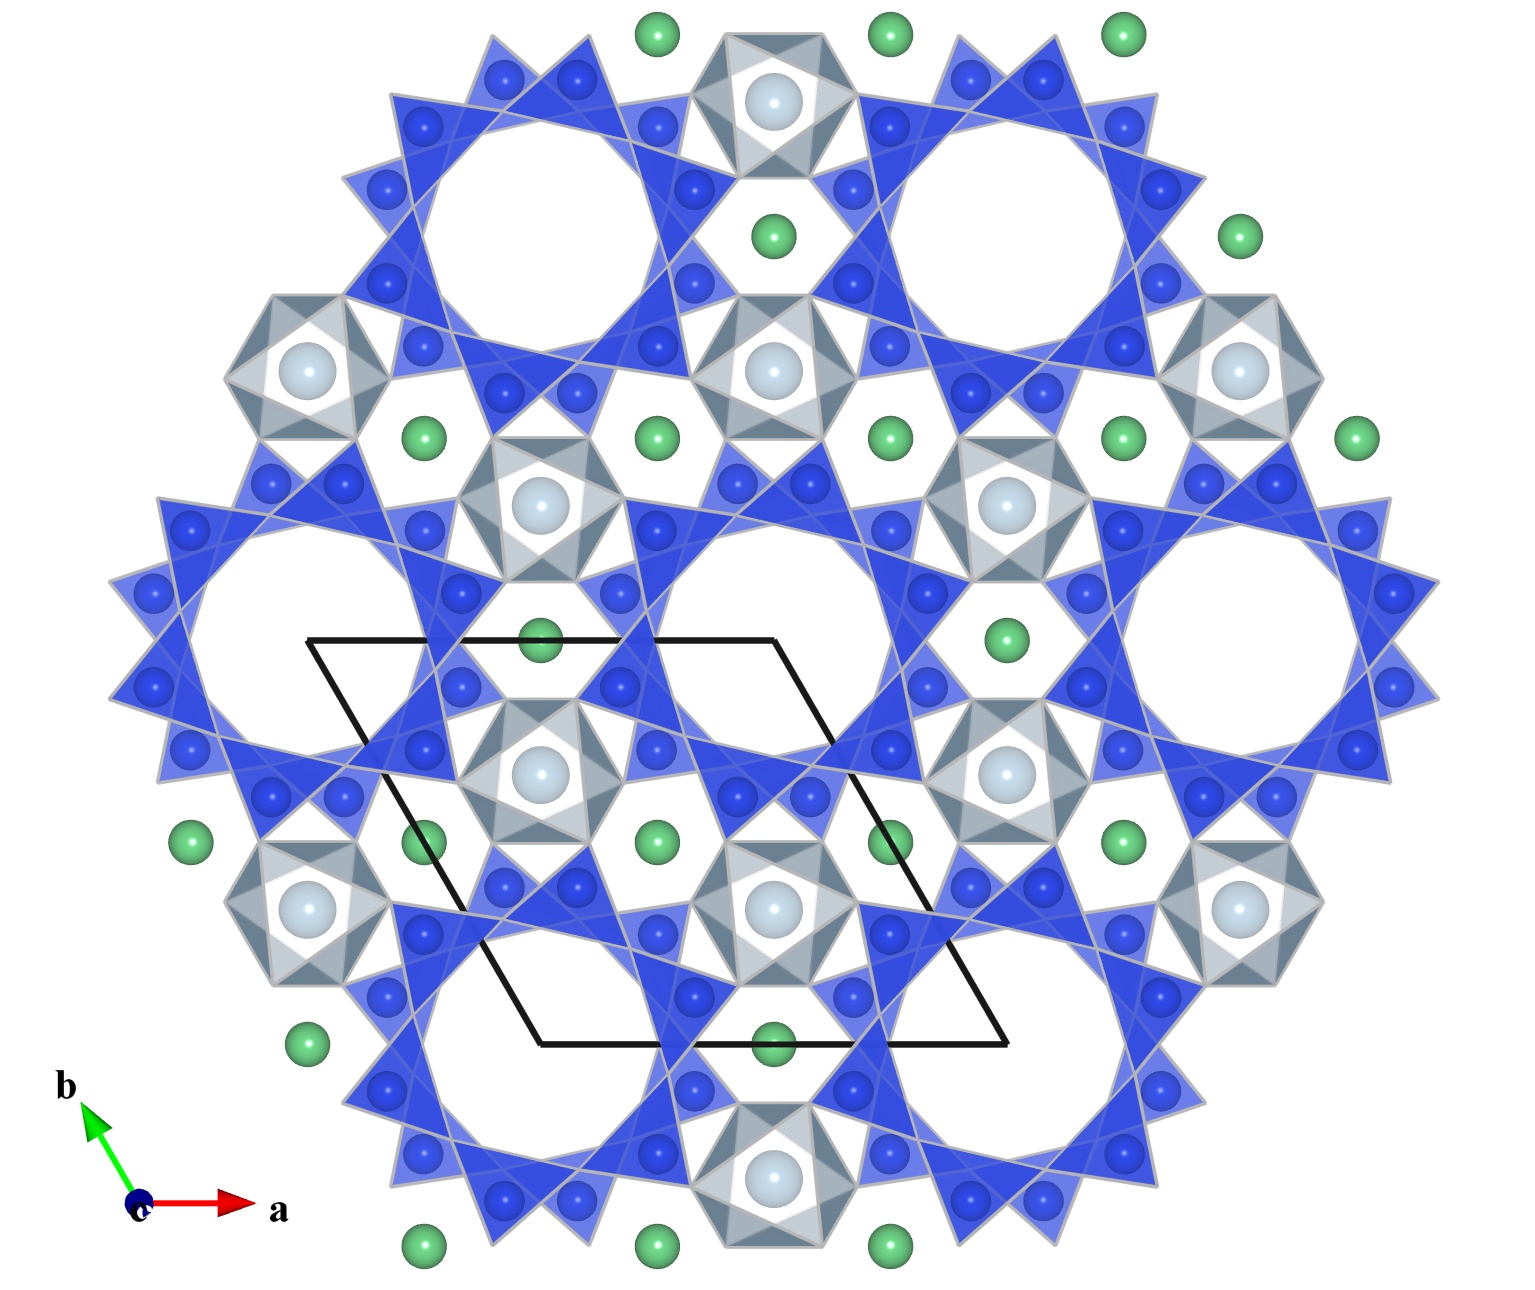
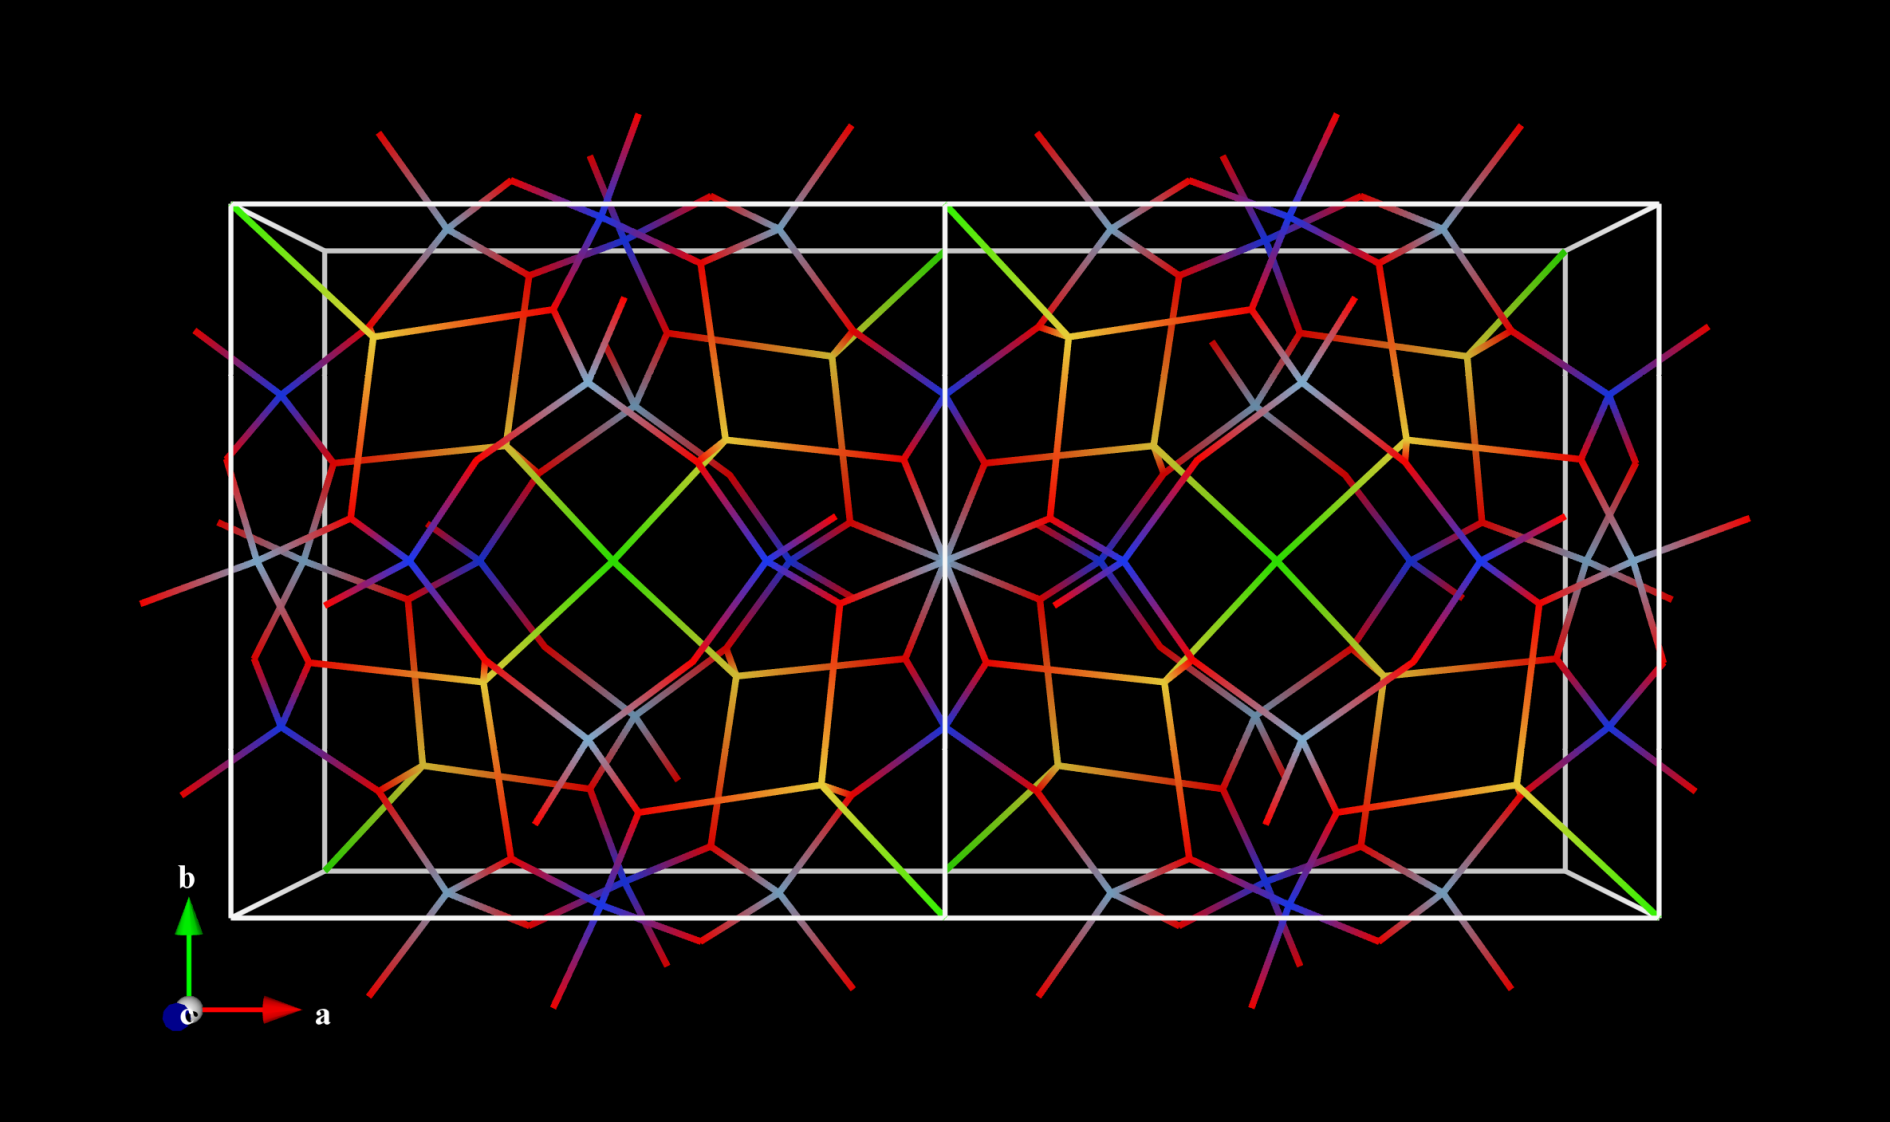
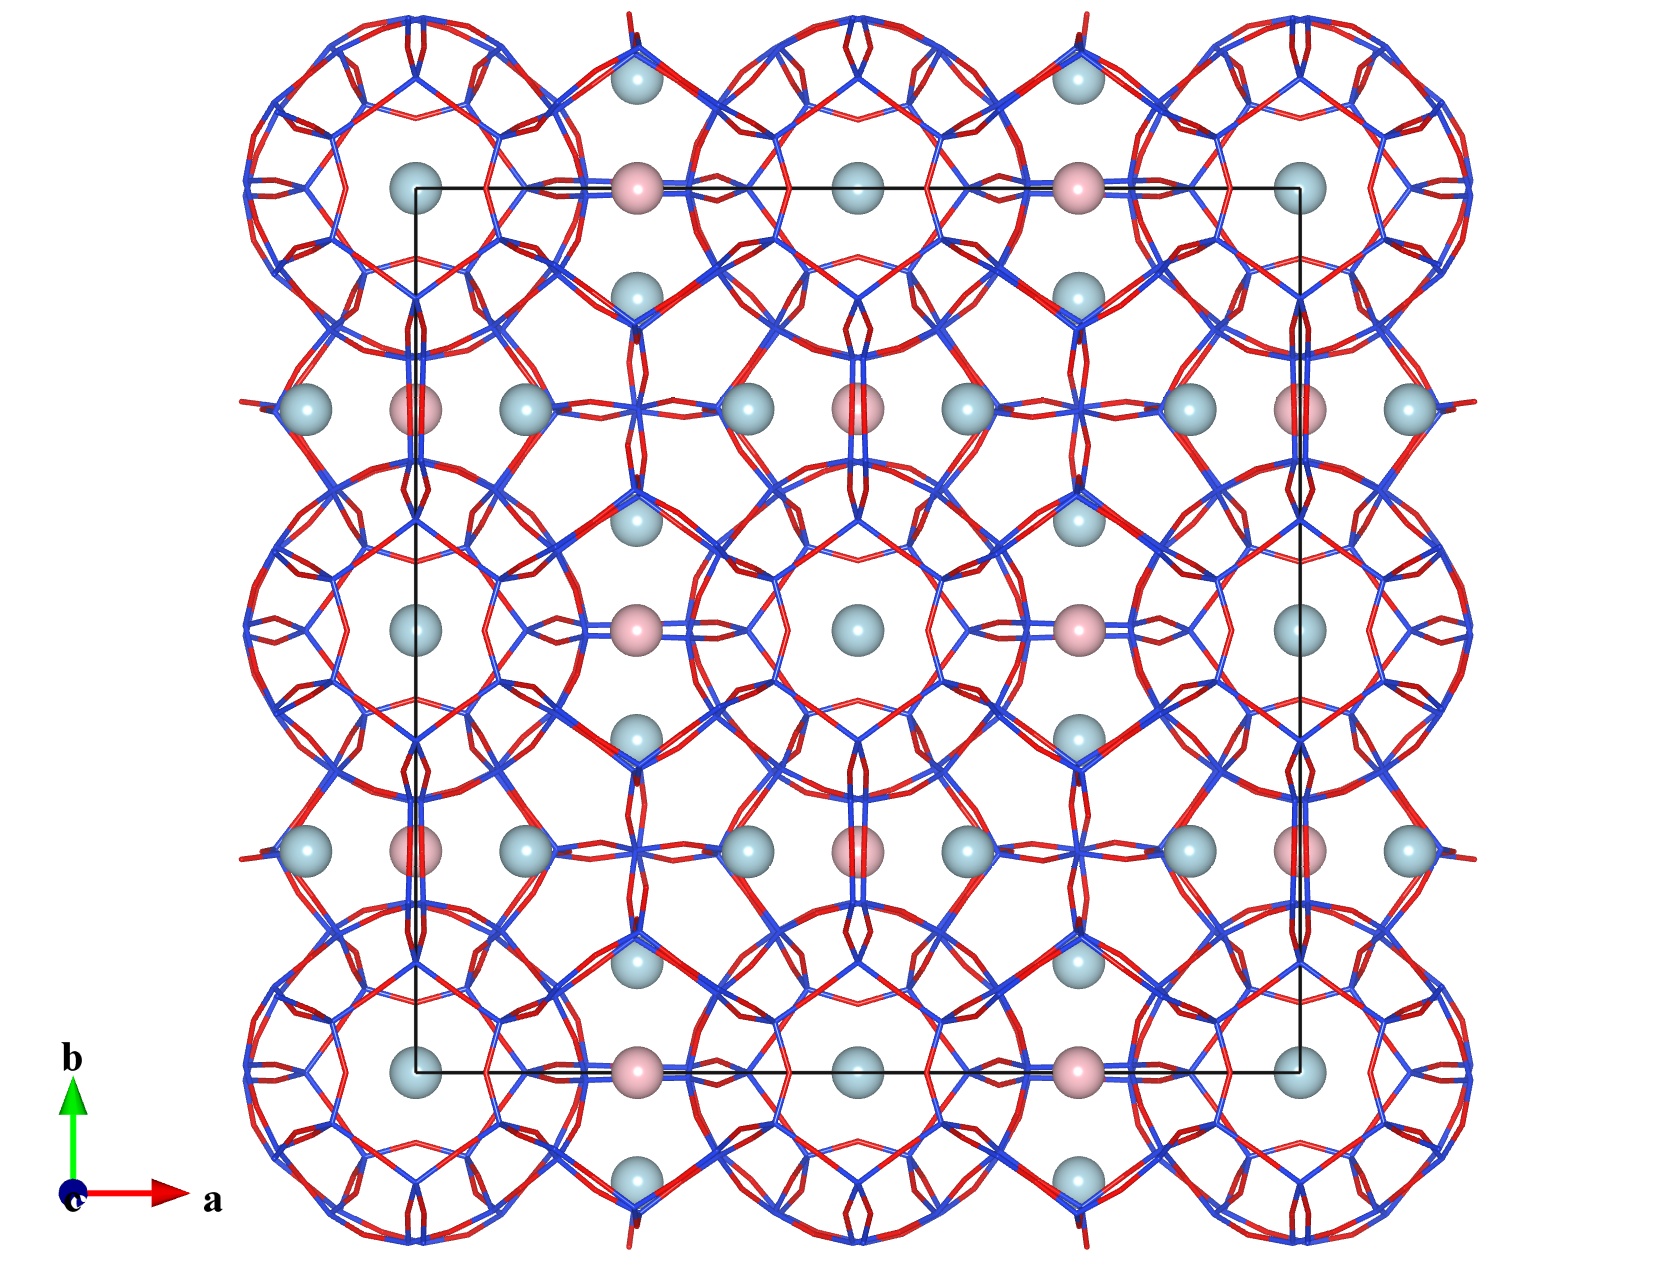
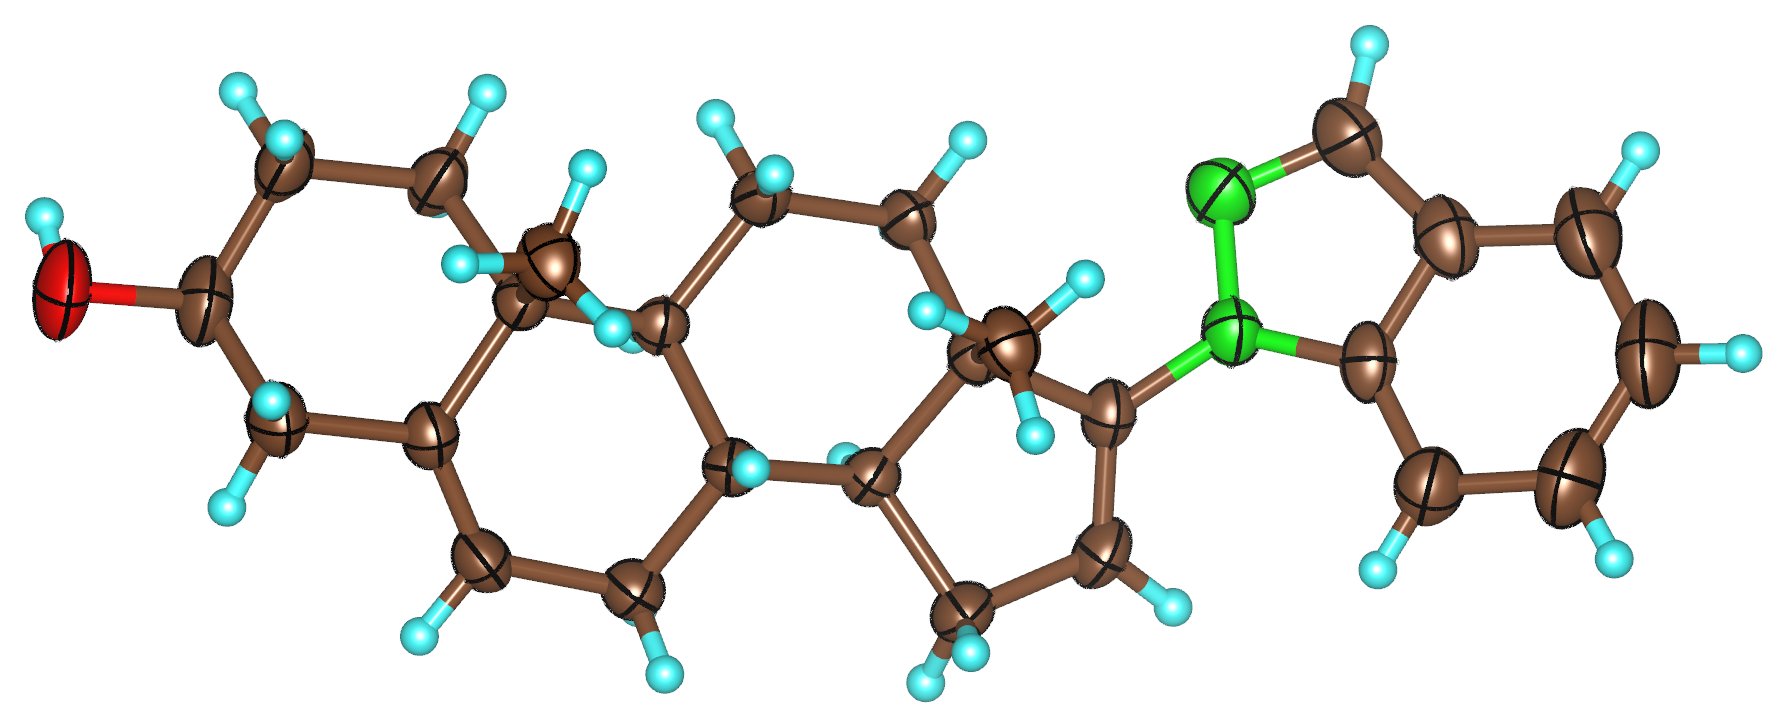
Structural models are represented as ball-and-stick (Fig. 2.2), space-filling (Fig. 2.3), polyhedral (Fig. 2.4), wireframe (Fig. 2.5), stick (Fig. 2.6), and displacement ellipsoid (Fig. 2.7) models. Ball-and-stick, wireframe, and stick models can be overlapped with dotted surfaces to accentuate outer surfaces of atoms. Polyhedra may be made translucent so as to make inside atoms and bonds visible.
Lattice planes with variable opacity can be inserted into a structural model. Vectors (arrows) can be attached to atoms to represent magnetic moments or directions of static and dynamic displacements.
You can superimpose multiple structural models in the same Graphic area to deal with grain boundary structures, absorption of atoms, molecules, nanosheet on a surface of crystal, or absorbed molecules in porous materials and layered structures.
Bond-search algorithm in VESTA is highly sophisticated; a variant of the cell index method by Quentrec and Brot [22, 23] was adopted. This approach is widely used in programs for molecular dynamics simulation that needs to deal with a large number of atoms.
2.2.1 A variety of structural information derived on selection of objects
Selection of objects (atoms, bonds, and coordination polyhedra) by clicking with a mouse provides us with a variety of structural information:
- fractional coordinates,
- symmetry operations and translation vectors,
- site multiplicities and Wyckoff letters [30],
- site symmetries,
- principal axes and mean square displacements of anisotropic atomic displacements,
- interatomic distances, bond angles, and dihedral angles,
- information about coordination polyhedra including volumes [31], Baur’s distortion indices [32], quadratic elongations [33], bond angle variances [33, 34, 35, 36], effective coordination number [34, 35, 36], charge distribution [35, 36, 37], bond valence sums of central metals [38, 39, 40], and bond lengths expected from bond valence parameters.1
2.3 Visualization of Volumetric Data
Electron and nuclear densities, wave functions, electrostatic potentials, Patterson functions, etc. are visualized as isosurfaces, bird’s-eye views, and two-dimensional (2D) maps. Multiple levels of translucent isosurfaces can be overlapped with a structural model. VESTA has a feature of surface coloring to illustrate another kind of a physical quantity at each point on isosurfaces; this feature has been thoroughly redesigned to improve the quality of images [11]. In VESTA, the visibility of both outlines of isosurfaces and an internal structural model has been surprisingly improved by introducing two opacity parameters. Further, we can add 2D slices of volumetric data in their 3D image. The quality of rendering isosurfaces, boundary sections, and slices by VESTA is very high even when the resolution of data is relatively low [11]. The calculation of isosurface geometry has been appreciably accelerated in VESTA by virtue of new algorithm adopted in VESTA [11].
VESTA has a feature to calculate electron and nuclear density distributions from structure parameters and atomic scattering factors. This feature is useful for comparison of the results of MEM with model densities.
Figure 2.8 illustrates isosurfaces of electron densities calculated with WIEN2k [41] for a superconductor MgB\(_2\) [42]. A network of highly covalent B–B bonds on the \(z=1/2\) plane and the ionic nature of bonds between Mg\(^{2+}\) ions (\(z=0\)) and B atoms are clearly visualized in this figure. A (001) slice of electron densities at the \(z=1/2\) level is depicted in Fig. 2.9. Such a kind of 2D maps are very useful particularly when part of atoms form 2D sheets e.g., CuO\(_2\) conduction sheets in high-\(T_{\mathrm {c}}\) superconducting oxides.
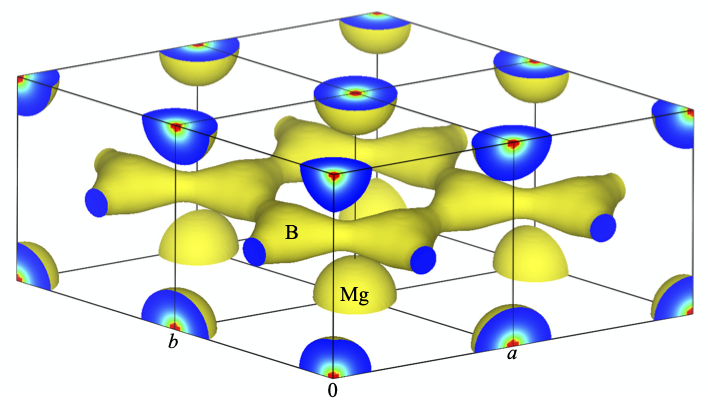
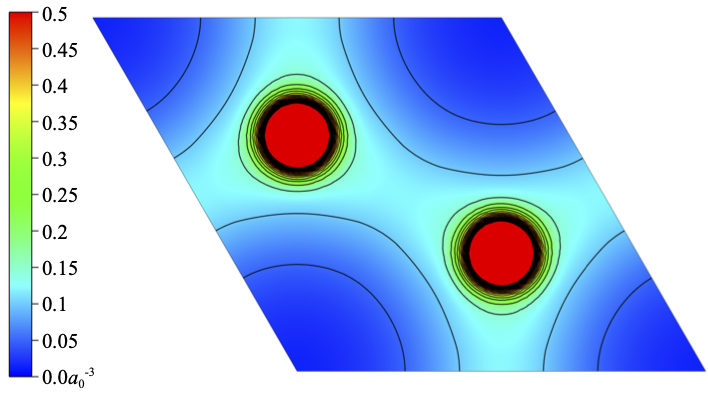
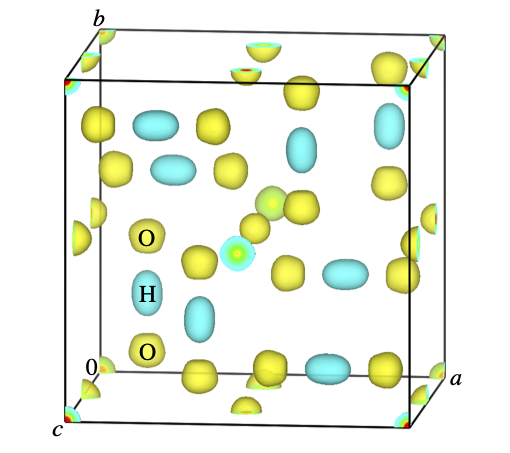
Figure 2.10 shows isosurfaces of scattering-length densities determined from neutron powder diffraction data of KH\(_2\)PO\(_4\) (paraelectric phase, space group: \(I\bar {4}2d\)) at room temperature by MEM-based pattern fitting [43]. In this way, two different colors are assigned to positive and negative isosurfaces. Blue isosurfaces (density: \(-2.5\) fm/Å\(^3\)) for H atoms are elongated toward yellow ones (density: 2.5 fm/Å\(^3\)) for O atoms because of double minimum potential with an H–H distance of about 0.36 Å.
2.4 Visualization of Crystal Morphologies
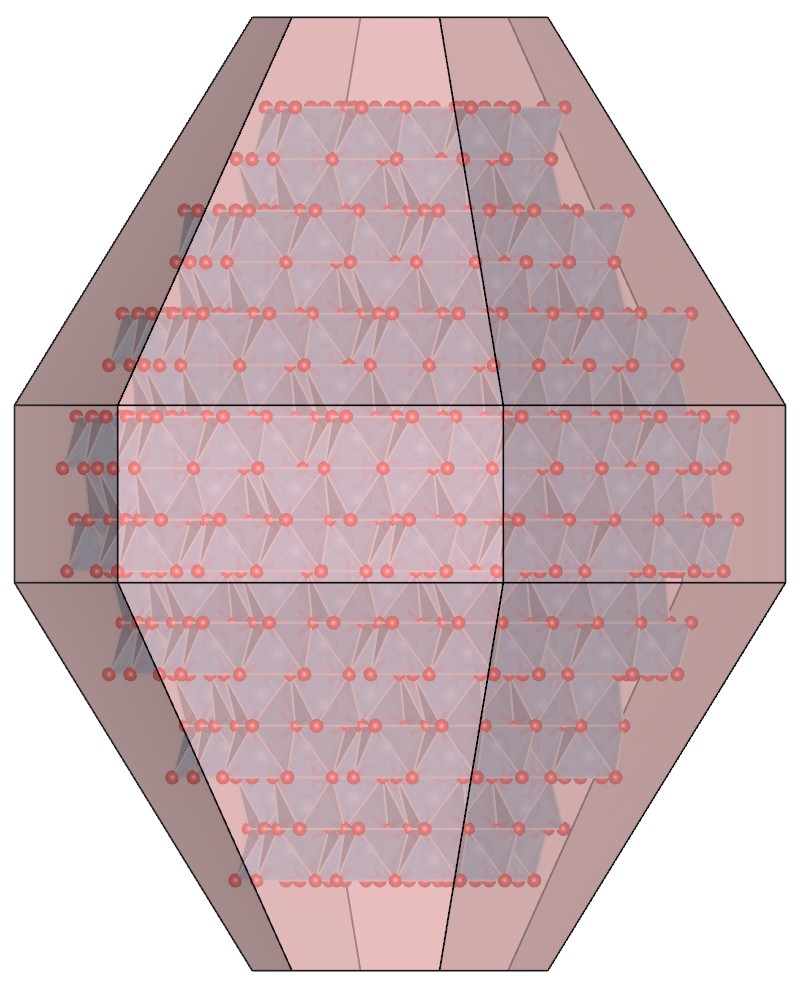
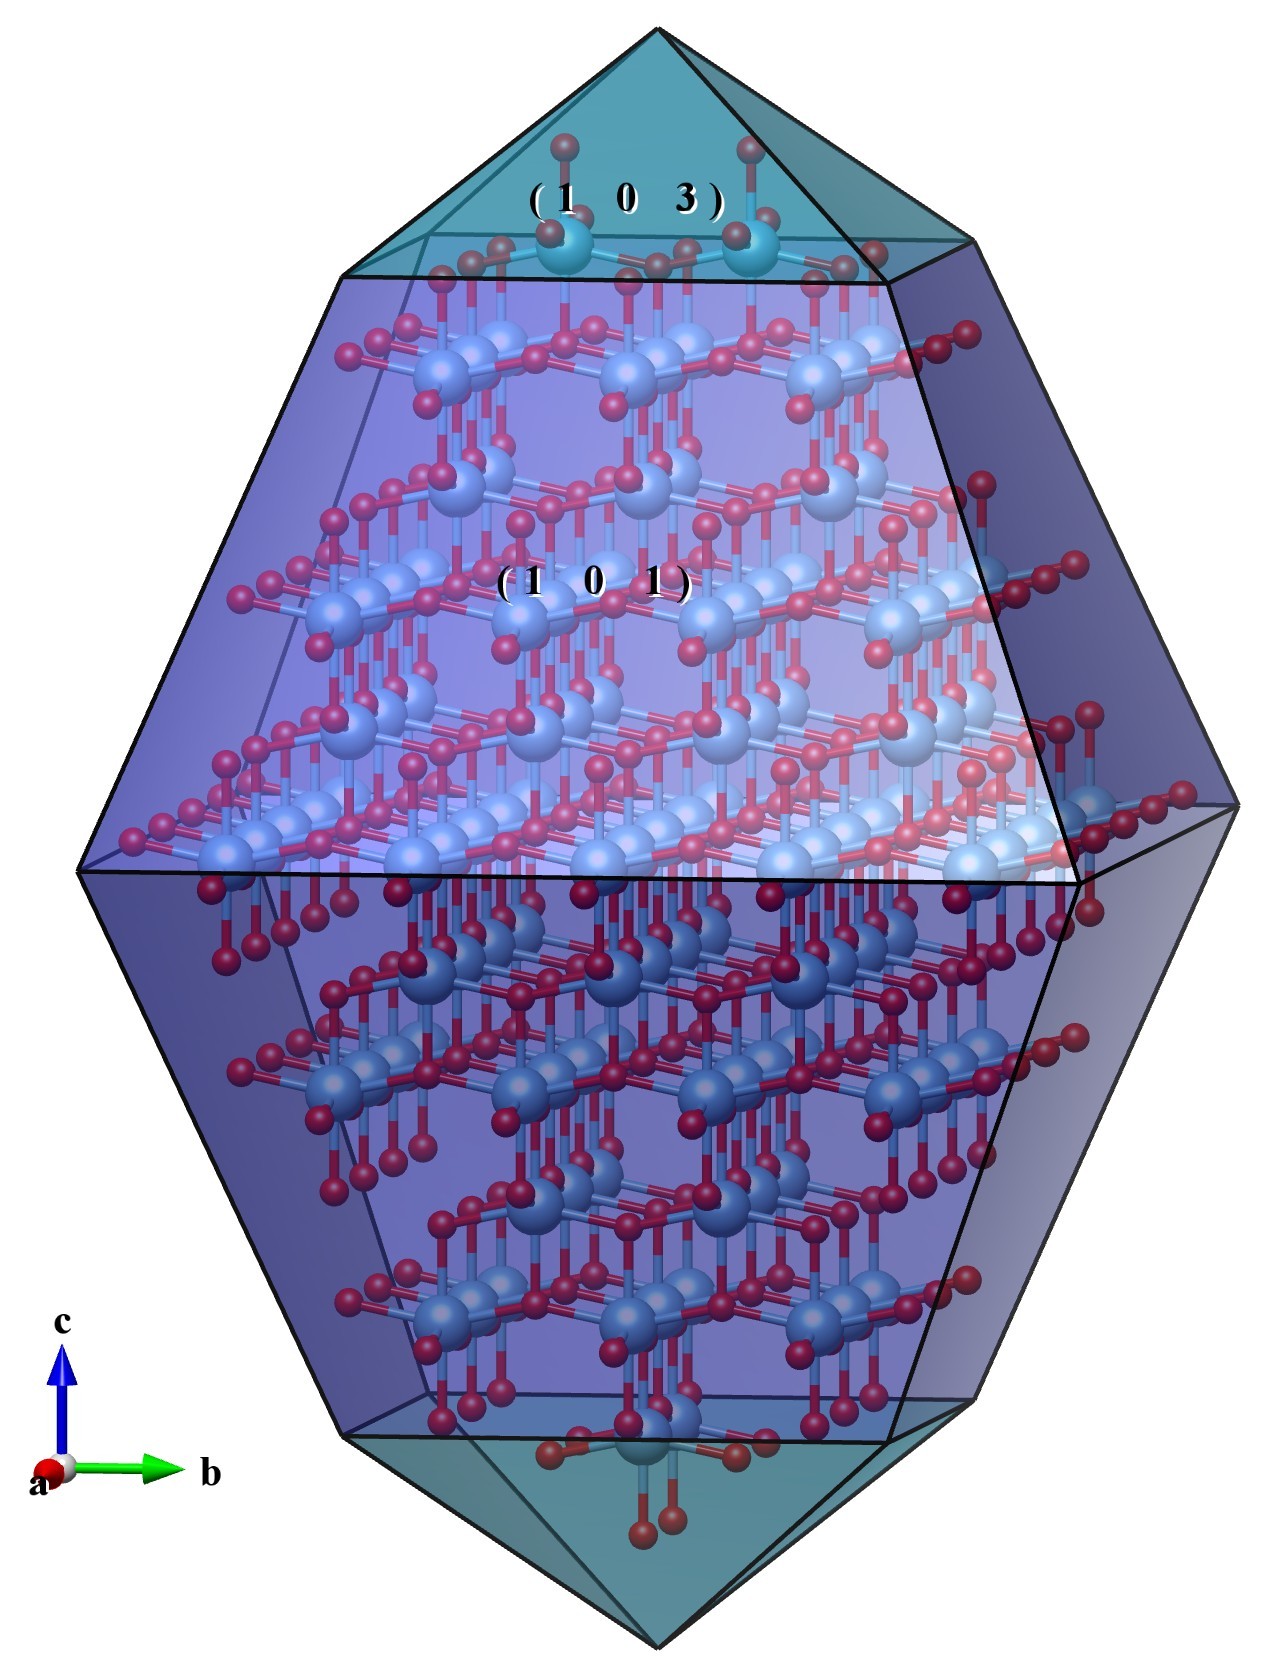
Crystal morphologies can be drawn by inputting Miller indices of faces (see section 6.5). Crystal faces can be overlapped with structural models as well as isosurfaces of volumetric data, as exemplified by Fig. 2.11. Thus, VESTA facilitates understanding of the relationship between crystal morphologies and chemical bonds, for example, by application of the periodic bond chain (PBC) theory [44]. For example, Fig. 2.12 illustrates an external morphology of anatase-type TiO\(_2\) superimposed on its ball-and-stick model. According to Hartman [44], the \(\{101\}\) face of anatase is an \(F\) face, where two PBCs are parallel to the plane. All the other \(\{h0l\}\) faces are \(S\) faces, where only one PBC is parallel to the plane. The PBC along \([010]\) is intuitively recognized by interactive rotation of the model in three dimensions.
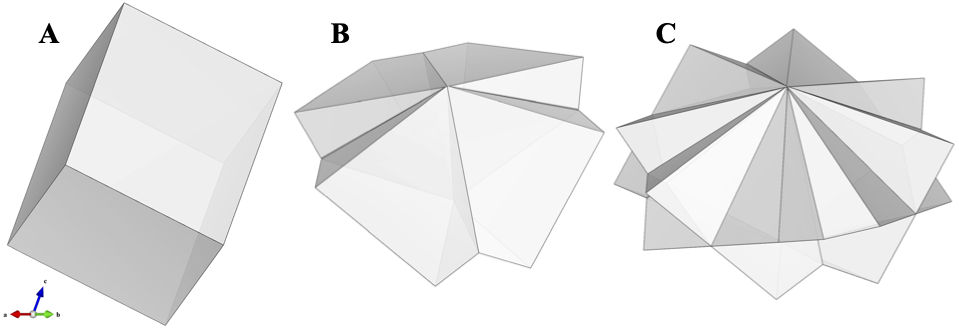
Morphologies of twinned crystals or epitaxial intergrowths of two or more crystals are visualized by inputting multiple crystal data (Fig. 2.13). After morphological data have been given, information about Miller indices, distances from the center of the crystal to faces, and the surface area of each face are output to the text area.
2.5 Cooperation with External Programs
VESTA collaborates closely with external programs such as ORFFE [45], STRUCTURE TIDY [46], RIETAN-FP [12], and MADEL (see section 14.5). On selection of a bond (2 atoms) or a bond angle (3 atoms) in a dialog box relevant to geometrical parameters output by ORFFE, the corresponding object in a ball-and-stick model is highlighted in a graphic window, and vice versa. STRUCTURE TIDY allows us to standardize crystal-structure data and transform the current unit cell to a Niggli-reduced cell. RIETAN-FP makes it possible to simulate powder diffraction patterns from lattice and structure parameters. With MADEL, electrostatic site potentials and a Madelung energy can be calculated from occupancies, fractional coordinates, and oxidation states of all the sites.
2.6 Input and Output Files
VESTA can read in files with 42 kinds of formats such as CIF, ICSD, and PDB and output files with 15 kinds of formats such as CIF and PDB (see chapter 18). Users of RIETAN-FP [12] must be pleased to learn that standard input files, *.ins, can be both input and output by VESTA. In addition, program ELEN [47] was built into VESTA for conversion of 3D electron densities into electronic-energy densities and Laplacians [48].
The entire crystal data and various settings can be saved in a small text file, *.vesta, without incorporating huge volumetric data. File *.vesta with the VESTA format contains relative paths to external data files of volumetric-data and optionally of structure-data that are automatically read in when *.vesta is reopened. VESTA also makes it possible to export graphic-data files with 14 image formats including 4 vector-graphic ones (see section 18.5.2).
2.7 Programming Concept
The source code of VESTA comprises GUI and core parts. In this section, only the fundamental concept of programming is briefly described. For further details in algorithmic techniques adopted in VESTA, please refer to Ref. [11].
2.7.1 Graphical user interface
The GUI of VESTA is built on top of a cross-platform application framework (toolkit), wxWidgets, written in the C++ language. The wxWidgets libraries are one of the best toolkits for cross-platform GUI programming. It provides us with a consistent look-and-feel inherent in each operating system. The license agreement of wxWidgets,2 an LGPL-like license with some exceptions allowing binary distribution without source code and copyright, is flexible enough to permit us to develop any types of applications incorporating wxWidgets.
2.7.2 Core libraries
In contrast to the GUI framework, the core parts of VESTA are carefully separated from the GUI parts to make it easier to reuse the former code. The core libraries are basically independent of the wxWidgets libraries.
