Chapter 5
DISPLAY STYLES
Display styles of structural models, volumetric data, and crystal shapes are controlled either from the Style tab of the Side Panel or from the “Objects” menu. Both of the methods allow us to use the same options.
5.1 Structural Models
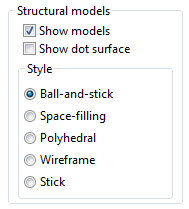
The Structural model frame box in the Style tab of the Side Panel (Fig. 5.1) contains frequently used tools to control representation of structural models. The same options can also be used by selecting the Model item under the “Objects” menu. This frame box is disabled for data containing no structural model.
5.1.1 Objects to be displayed
Show model
This option controls the visibility of a structural model. When this option is checked (default), a structural model is visible; otherwise, no structural model is shown. Uncheck this option when you want to see only isosurfaces and sections for data containing both structural and volumetric ones.
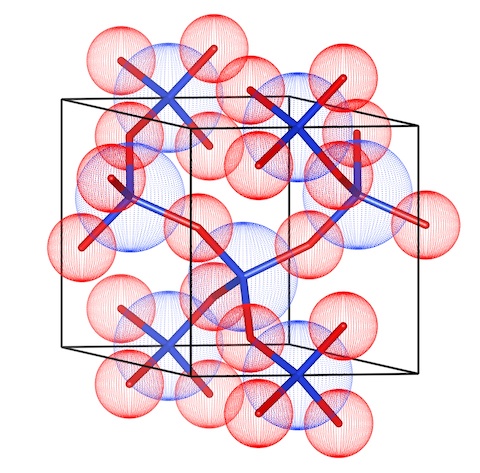
Show dot surface
In ball-and-stick, wireframe, and stick models, dot-surface spheres are added with radii corresponding to 100 % of user specified ones in the same manner as with a space-filling model if Show dot surface is checked (Fig. 5.2). This mode is designed to accentuate outer surfaces of atoms. Each sphere is represented as though it were a hollow shell with numerous dots placed on the surface. The combination of dot surface with a stick model is useful for understanding how atoms are combined with each other in a molecule. The density of dots is controlled by two parameters, {Stacks} and {Slices} in the Atoms page of the Properties dialog box as with the same manner as solid spheres.
5.1.2 Styles
As described in 2.2, VESTA represents crystal structures by the five different styles: ball-and-stick, space-filling, polyhedral, wireframe, and stick models. When atoms are drawn as spheres, they are rendered with radii corresponding to 40 % of actual atomic radii in all but the space-filling model, where atoms are rendered with the actual atomic radii. Default radii of atoms are selected from three types: atomic, ionic, and van der Waals radii. The radius of each element and a type of radii are specified at the Atoms page in the Properties dialog box (see section 12.1.2). Features in each structural model are described below with screenshots of the structure for quartz [49] on the right side.
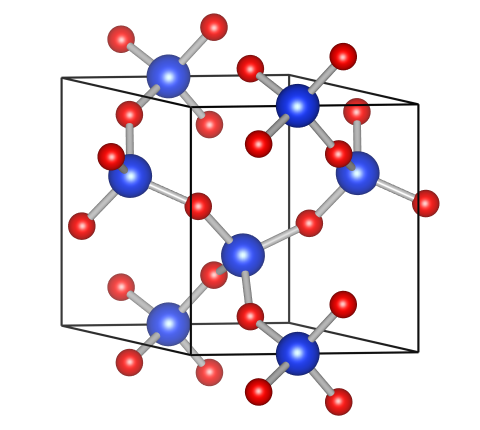
“Ball-and-stick”
In the “Ball-and-stick” model, all the atoms are expressed as solid spheres or displacement ellipsoids. Bonds are expressed as either cylinders or lines.
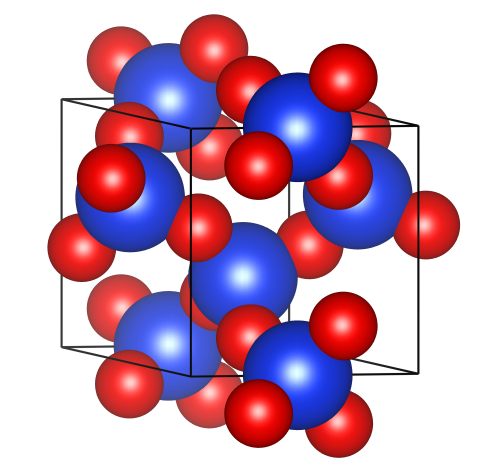
“Space-filling”
In the “Space-filling” model, atoms are drawn as interpenetrating solid spheres, with radii specified at the Atoms tab in the Properties dialog box (see section 12.1.2). This model is useful for understanding how atoms are packed together in the structure.
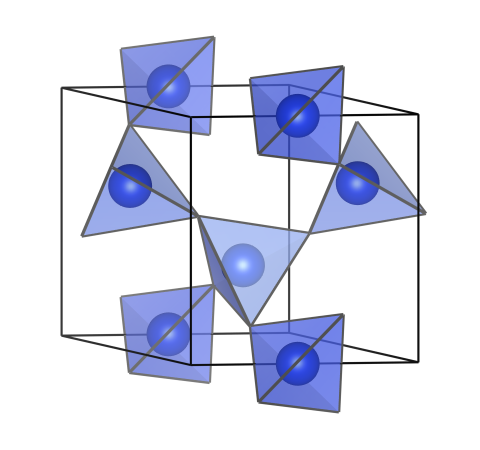
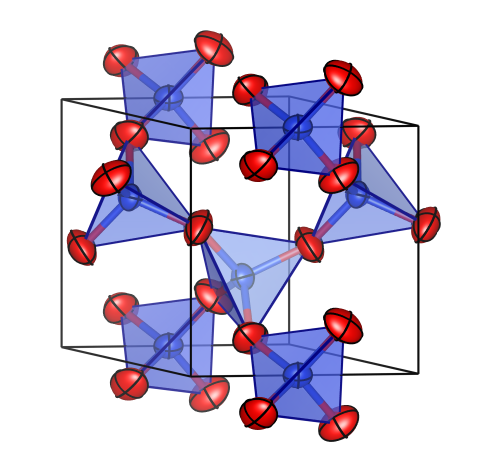
“Polyhedral”
In the polyhedral model, crystal structures are represented by coordination polyhedra where central atoms, bonds, and apex atoms may also be included. Bonds between central and apex atoms have to be searched with the Bonds dialog box to display coordination polyhedra comprising them. Atoms are expressed as solid spheres or displacement ellipsoids. Bonds are expressed as either cylinders or lines. Needless to say, the transparency of the coordination polyhedra must be high enough to make it possible to see the central atoms and bonds. One of six different styles for representing polyhedra is specified at the Polyhedra tab in the Properties dialog box (see section 12.1.4).
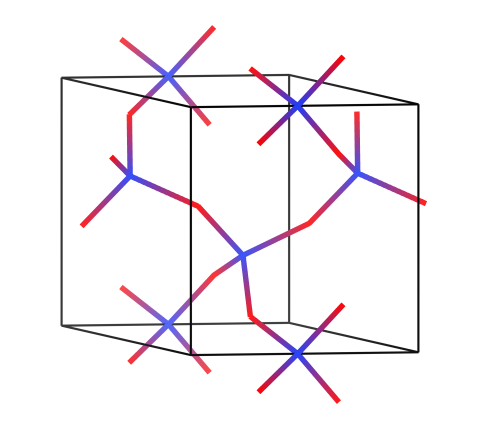
“Wireframe”
In the “Wireframe” model, atoms having no bonds are drawn as wire-frame spheres whereas those bonded to other atoms are never drawn. All the bonds are presented as lines with gradient colors. This model is useful for seeing and manipulating complex and/or large structures because this is usually the fastest model for rendering structures on the screen.
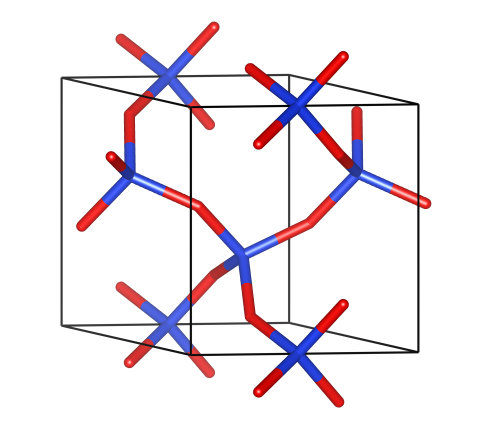
“Stick”
In the “Stick” model, atoms with no bonds are drawn as solid spheres while atoms bonded to other atoms are never drawn. All the bonds are expressed as cylinders, whose properties can be changed at the Bonds tab in the Properties dialog box (see section 12.1.3). This model serves to see frameworks or molecular geometry.
Displacement ellipsoids
In the ball-and-stick and polyhedral models, atoms can be rendered as displacement ellipsoids. The probability for atoms to be included in the ellipsoids is also specified in the Properties dialog box (see section 12.1.2).
5.2 Volumetric Data
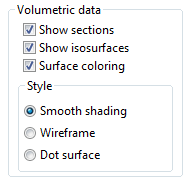
The Volumetric data frame box in the Style tab of the Side Panel (Fig. 5.3) contains frequently used tools to control representation of volumetric data. The same options can also be used by selecting the “Volumetric Data” item under the “Objects” menu. This frame box is disabled for data containing no volumetric ones.
- Show sections
This option controls whether or not sections of isosurfaces are visible. When this option is checked (default), sections are visible, otherwise they are not shown. - Show isosurfaces
This option controls whether or not isosurfaces of volumetric data are visible. When this option is checked (default), isosurfaces are visible, otherwise they are not shown. To see only a structural model for data containing both structural and volumetric ones, uncheck this option in addition to the “Show sections” option.
- Surface coloring
“Surface coloring” means that colors of isosurfaces drawn from one data set are determined by a secondary data set. A typical example is coloring of electron-density isosurfaces on the basis of electrostatic potentials (see Fig. 12.9). This option is enabled only when the secondary volumetric data for surface coloring has been loaded with the Volumetric data tab in the Edit Data dialog box (see 6.4.2).
Styles of isosurfaces are chosen from the following three representations:
Isosurfaces are drawn as solid surfaces with variable opacity in the Smooth shading mode whereas isosurfaces are represented by lines and points, respectively, in the Wireframe and Dot surface modes.
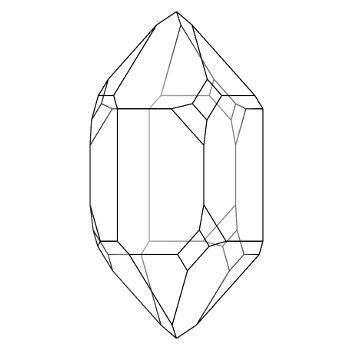
5.3 Crystal Shapes
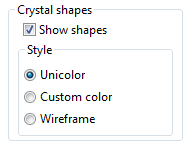
The Crystal Shapes frame box in the Style tab of the Side Panel (Fig. 5.4) provides us with tools to control representation of crystal morphologies. The same options can also be used by selecting the “Crystal Shapes” item under the “Objects” menu. This frame box is disabled for data containing no morphology data (faces).
- Show shapes
This option controls whether or not the external morphology of crystals are visible. When this option is checked (default), morphologies are visible, otherwise they are not shown.
5.3.1 Styles
VESTA represents crystal morphologies by the following three styles:
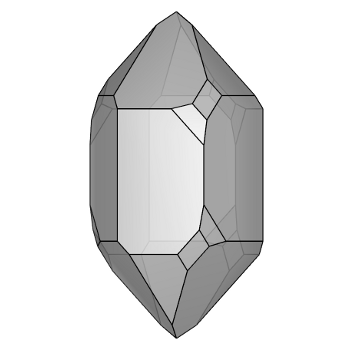
“Unicolor”
All the faces of a crystal are filled with a single color, as the right figure (quartz) illustrates.
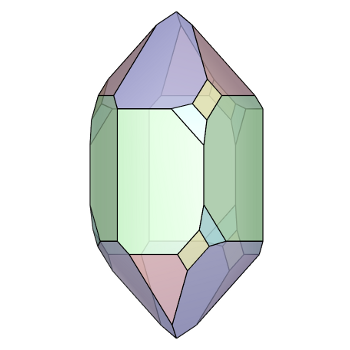
“Custom color”
Each face is filled with a color assigned to symmetrically equivalent \(\{hkl\}\) faces specified in the Edit Data dialog box (see section 6.5) or in the Side Panel.
“Wireframe”
Only edges of a crystal shape are drawn with lines.