
Chapter 4
MAIN WINDOW
4.1 Components of the Main Window
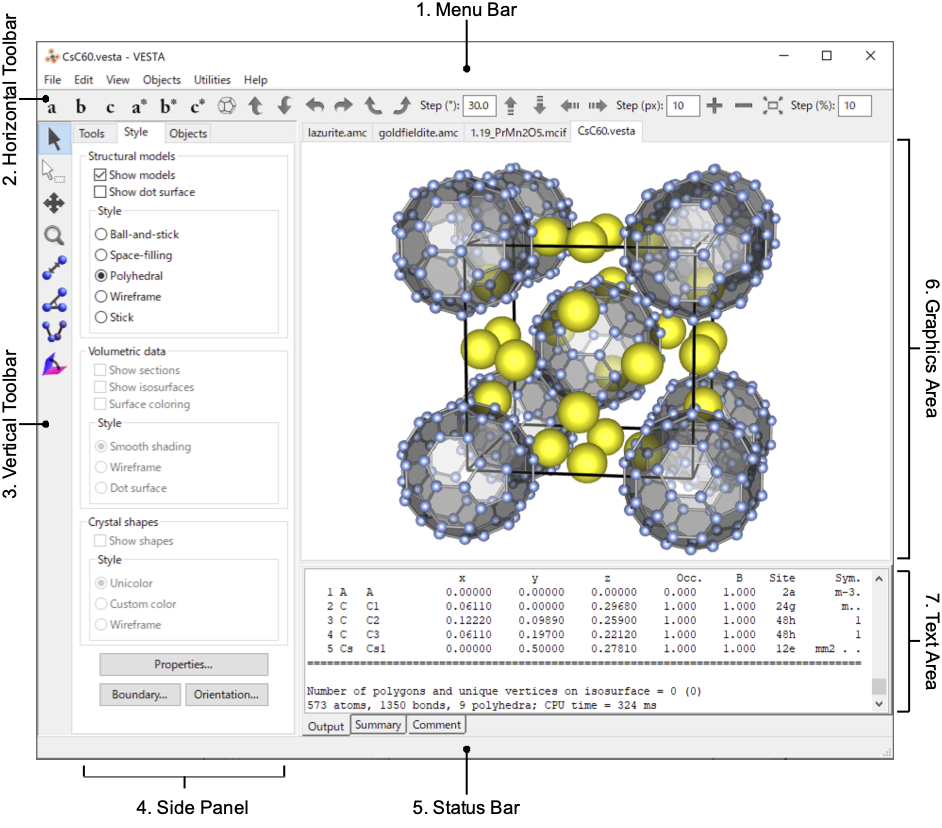
Figure 4.1 shows the main window of VESTA running on Windows 7. The Main Window consists of the following seven parts:
- 1.
- Menu bar: “File”, “Edit”, “View”, “Objects”, “Utilities”, and “Help” menus are placed on the menu bar. The menu bar is placed at the top of the Main Window in Windows and Linux while the menus are displayed at the top of the screen in macOS.
- 2.
- Horizontal Toolbar: Tools used frequently (see section 4.3).
- 3.
- Vertical Toolbar: Other tools used frequently (see section 4.4).
- 4.
- Side Panel: Composed of three tab pages. The Tools tab contains options for GUI tools in the Vertical Toolbar (see chapter 11). The Style tab contains GUI tools for display styles (see chapter 5). The Objects tab shows a list of phases and objects in each phase (see chapter 12.2).
- 5.
- Status Bar: An area to show brief information in a line of text.
- 6.
- Graphics Area: An area where various objects are displayed in three dimensions.
- 7.
- Text Area: Two types of texts are displayed here (see section 4.5). A variety of information related to users’ operations is displayed in the Output tab. In the Comment tab, comments on data displayed currently can be input.
4.2 Menus
4.2.1 File menu
- New Structure...: Open a Edit Data dialog box to input crystal data of a new structure.
- New Window...: Open a new Main Window.
- Open...: Open files with a file selection dialog box.
- Save...: Save current data to a file, *.vesta, with the VESTA format. If the current data has been input from *.vesta or once saved as *.vesta, *.vesta is overwritten. Otherwise, a file selection dialog box will appear to prompt you to input a new file name.
- Save As...: Save current data to a new file, *.vesta, with the VESTA format. A file selection dialog box will appear to prompt you to input a new file name.
- Export Data...: Export current data to a file with formats other than the VESTA format.
- Export Raster Image...: Export a graphic image to a file with a raster (pixel-based) format.
- Export Vector Image...: Export a graphic image to a file with a vector format.
- Save Output Text...: Save text data in the Text Area as a text file.
- Close: Close the current page. When no data are displayed, this menu is practically the same as the Exit menu.
- Exit: Exit VESTA.
4.2.2 Edit menu
- Undo: Undo the last action.
- Redo: Redo an action that has just been undone.
- Edit Data:
- Phase…: Open an Edit Data dialog box to select the Phase page.
- Unit Cell…: Open an Edit Data dialog box to select the Unit Cell page.
- Structure Parameters…: Open an Edit Data dialog box to select the Structure parameters page.
- Volumetric Data…: Open an Edit Data dialog box to select the Volumetric data page.
- Crystal Shape…: Open an Edit Data dialog box to select the Crystal shape page.
- Bonds...: Open a Bonds dialog box to create or edit data related to bonds.
- Vectors...: Open a Vectors dialog box.
- Lattice Planes...: Open a Lattice Planes dialog box.
- Preferences...1 : Open a Preferences dialog box.
4.2.3 View menu
- Antialiasing: Enable or disable antialiasing in the Graphics Area.
- Parallel: Switch to parallel representation.
- Perspective: Switch to perspective representation.
- Zoom In: Zoom in objects.
- Zoom Out: Zoom out objects.
- Fit to Screen: Scale and center justify objects to fit to the Graphics Area.
- Overall Appearance...: Open an Overall Appearance dialog box.
- Clear Text Are: Clear all the text in the Text Area.
4.2.4 Objects menu
- Structural Model: items of this menu can be also selected in the Side Panel.
- Show Model: Show or hide a structural model.
- Show Dot Surface: Show or hide outer surfaces of atoms as dotted surfaces.
- Ball-and-Stick: Show a ball-and-stick model.
- Space-filling: Show a space-filling model.
- Polyhedral: Show a a polyhedral model.
- Wireframe: Show a wireframe model.
- Stick: Show a stick model.
- Volumetric Data: items of this menu can be also selected in the Side Panel.
- Show Isosurfaces: Show or hide isosurfaces.
- Show Sections: Show or hide sections of isosurfaces.
- Surface Coloring: Enable or disable the surface coloring of isosurfaces.
- Smooth Shading: Show isosurfaces with a smooth-shading model.
- Wireframe: Show isosurfaces with a wireframe model.
- Dot Surface: Show isosurfaces as dotted surface.
- Properties
- General...: Open a Properties dialog box to select the General page.
- Atoms...: Open a Properties dialog box to select the Atoms page.
- Bonds...: Open a Properties dialog box to select the Bonds page.
- Polyhedra...: Open a Properties dialog box to select the Polyhedra page.
- Isosurfaces...: Open a Properties dialog box to select the Isosurfaces page.
- Sections...: Open a Properties dialog box to select the Sections page.
- Boundary...: Open a Boundary dialog box.
- Orientation...: Open an Orientation dialog box.
4.2.5 Utilities menu
- Equivalent Positions...: Open an Equivalent Positions dialog box to list general equivalent positions.
- Geometrical Parameters...: Open a Geometrical Parameters dialog box.
- Standardization of Crystal Data...: Standardize the space-group setting and fractional coordinates.
- Niggli-Reduced Cell: Transform the current unit cell to a Niggli-reduced cell.
- Site Potentials and Madelung Energy...: Calculate site potentials and the Madelung energy of the currently displayed crystal by an external program, MADEL.
- Powder Diffraction Pattern...: Simulate a powder diffraction pattern with RIETAN-FP [12] and display the result with an external graph-plotting program.
- Structure Factors...: Calculate structure factors.
- Fourier Synthesis...: Calculate electron/nuclear densities from structure factors.
- Model Electron Densities: Calculate electron densities from structure parameters.
- Model Nuclear Densities: Calculate nuclear densities from structure parameters.
- Patterson Densities:
- From Model Electron Densities…: Calculate and display density distributions of Patterson function from model electron densities.
- From Model Nuclear Densities…: Calculate and display density distributions of Patterson function from model nuclear densities.
- From Volumetric Data…: Calculate and display density distributions of Patterson function from the currently displayed volumetric data.
- 2D Data Display...: Open a 2D Data Display window.
- Line Profile...: Calculate a line profile of volumetric data between two positions and output them in a text file.
- Peak Search...: Search peaks in volumetric data.
- Conversion of Electron Densities...: Convert 3D electron densities into electronic-energy densities and Laplacians.
4.2.6 Help menu
- Manual...: Open the user’s manual of VESTA in a PDF viewer.2
- Check for Updates...: Open the web page of VESTA3 with a browser to check whether or not a new version of VESTA has been released.
- About VESTA...4 : Show information about VESTA.
4.3 Tools in the Horizontal Toolbar
4.3.1 Alignment
| View along the a axis | ||
| View along the b axis | ||
| View along the c axis | ||
| View along the a* axis | ||
| View along the b* axis | ||
| View along the c* axis | ||
The above six buttons are used to align objects parallel to the \(a\), \(b\), or \(c\) axis, or parallel to the \(a^*\), \(b^*\), or \(c^*\) axis, respectively.
4.3.2 Rotation
| Rotate around the x axis | ||
| Rotate around the x axis | ||
| Rotate around the y axis | ||
| Rotate around the y axis | ||
| Rotate around the z axis | ||
| Rotate around the z axis | ||
These six buttons are used to rotate objects around the \(x\), \(y\), or \(z\) axis. The step width of rotation (in degrees) is specified in the text box next to the sixth button:
![]()
4.3.3 Translation
| Translate upward | ||
| Translate downward | ||
| Translate leftward | ||
| Translate rightward | ||
These four buttons are used to translate objects upward, downward, leftward, and rightward, respectively. The step width of translation (in pixels) is specified in the text box next to the fourth button:
![]()
4.3.4 Scaling
| Zoom in | ||
| Zoom out | ||
| Fit to the screen | ||
These three buttons are used to change object sizes. The step width of zooming (in %) is specified in a text box next to the third button:
![]()
4.4 Tools in the Vertical Toolbar
| Rotate | ||
| Select | ||
| Translate | ||
| Magnify | ||
| Measure distance | ||
| Measure angle | ||
| Measure dihedral angle | ||
| Measure an interfacial angle | ||
4.5 Text Area
4.5.1 Output tab
The Output area is a standard-output window corresponding to the Command Prompt window on Windows and a Terminal window on macOS or Linux. Just after launching VESTA, the Output area displays information about the PC you are using. OpenGL version denotes the version of OpenGL implementation supported by the system. Video configuration provides information about the GPU. For example, in a Windows PC equipped with Quadro FX 4600, a message
Video configuration: Quadro FX 4600/PCI/SSE2
is displayed in the Text Area. SSE2 means that Streaming SIMD Extensions 2 is supported in this graphics card. In the case of a Power Mac G5 (Dual 2.5 GHz) equipped with ATI Radeon 9600 XT, a message
Video configuration: ATI Radeon 9600 XT OpenGL Engine
is issued in the Text Area. If the GPU of your PC does not support any hardware acceleration of OpenGL, Video configuration would be GDI Generic on Windows, and Software Rasterizer or Mesa GLX Indirect on Linux.
When a new file is loaded, a summary of data appears in the Output area, including the absolute path of the file and the title of the data. For crystal-structure data, lattice parameters, a unit-cell volume, and structure parameters (element names, site names, fractional coordinates, occupancies, isotropic atomic displacement parameters, multiplicities plus Wyckoff letters, and site symmetries) are output. In the case of volumetric data, lattice parameters, number of grids along each axis, and number of polygons and unique vertices on slices and isosurfaces are displayed. For instance, a CIF of PbSO\(_4\) affords the following output:
Title               O4 Pb1 S1

Lattice type        P
Space group name    P n m a
Space group number  62
Setting number      1

Lattice parameters

   a        b        c       alpha    beta     gamma
 8.51600  5.39900  6.98900  90.0000  90.0000  90.0000

Unit-cell volume = 321.339447

Structure parameters

                       x          y          z          g        Occ  Site    Sym.
   1 Pb  Pb1         0.18820    0.25000    0.16700    1.000    1.200    4c     .m.
   2 S   S1          0.43700    0.75000    0.18600    1.000    0.700    4c     .m.
   3 O   O1          0.59500    0.75000    0.10000    1.000    1.600    4c     .m.
   4 O   O2          0.31900    0.75000    0.04300    1.000    1.600    4c     .m.
   5 O   O3          0.41500    0.97400    0.30600    1.000    1.600    8d       1
Such a type of a list is also output when pressing [OK] button in the Edit Data dialog box.
4.5.2 Summary tab
The Summary tab gives a brief summary of data including data name, space group, unit cell parameters, unit cell volume, and number of grids of volumetric data. An example output is as follows.
  NaV6O11
  Space Group: P 63/m m c  (#194-1)
  a =  5.70918 Å       = 90.0000°    grid(x) = 120
  b =  5.70918 Å       = 90.0000°    grid(y) = 120
  c = 13.08744 Å       =120.0000°    grid(z) = 240
  V = 369.4305 Å^3
4.5.3 Comment tab
You can input any comments relevant to data displayed currently. VESTA also reads in some information on the data from files (*.amc) of the American Mineralogist Crystal Structure Database format. For example, the following information is read in from *.amc for anatase-type TiO\(_2\) and displayed in the Comment area.
Horn M, Schwerdtfeger C F, Meagher E P
Zeitschrift fur Kristallographie 136 (1972) 273-281
Refinement of the structure of anatase at several temperatures
Sample: T = 25 C
Locality: Legenbach quarry, Binnatal, Switzerland
_database_code_amcsd 0010735
