Chapter 7
OVERLAYING MULTIPLE DATA
To display multiple-phase data in a single Graphics Area, set positioning and orientation of each phase after clicking the Phase tab in the Edit Data dialog box (Fig. 7.1). The positioning and orientation of a phase are specified relative to another phase or the Cartesian coordinate system that is commonly used as internal representation of all phases. By default, the origin, \((0, 0, 0)\), of a phase is placed at that of the internal coordinate system. The orientation of a phase is set such that the [1 0 0] axis of a phase is parallel to the \(x\) axis of the internal coordinate system with the [0 1 0] axis parallel to the \(x\)–\(y\) plane.
To avoid the circular reference of phases, positioning and orientation must be set in descending order of the phase list.
7.1 Positioning of Phases
At first, select a phase to edit in the phase list (Fig. 7.1, a). In the Positioning frame box, select another phase (layer) which is used as a reference of positioning (Fig. 7.1, b).
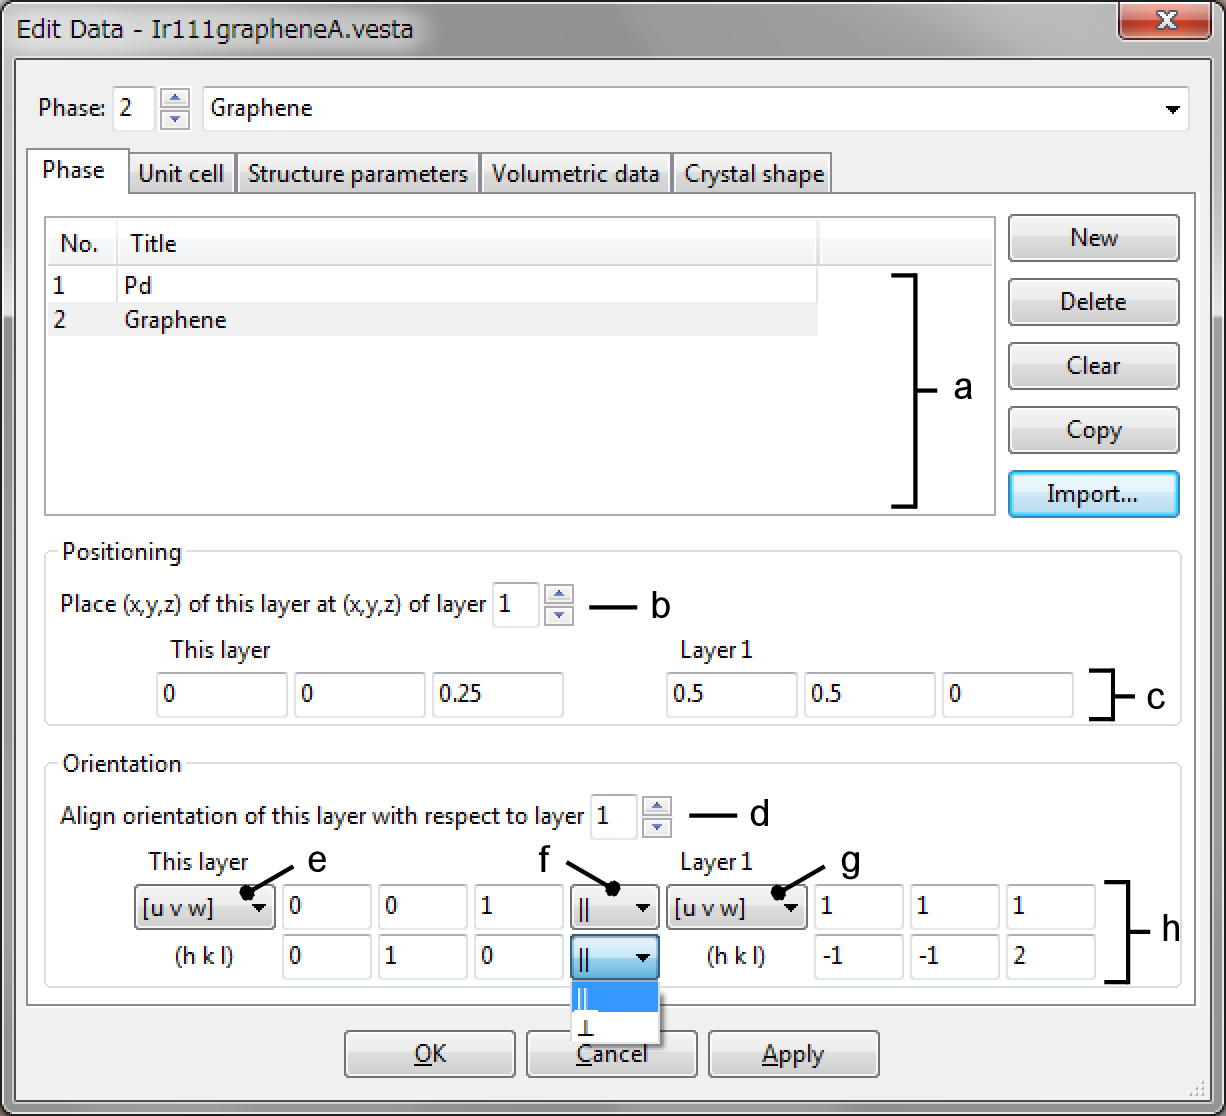
Layer 0 denotes the internal Cartesian coordinate system. Then, input \((x,y,z)\) coordinates of the selected and reference layers; they are exactly overlapped with each other (Fig. 7.1, c).
7.2 Relative Orientation of Phases
Select a phase to edit in the phase list, and select ID’s of another phase (layer) in the Orientation frame box (Fig. 7.1, d). As described above, layer 0 represents the internal Cartesian coordinate system. A set of a lattice vector and a reciprocal-lattice vector is specified for both of the current and reference layers. When the first vector is specified by a vector, [\(u\) \(v\) \(w\)], in the direct space, the other one is specified by a reciprocal-lattice vector, [\(h\) \(k\) \(l\)]\(^*\), and vise versa. The direct- and reciprocal-lattice vectors must be perpendicular to each other; in other words, the lattice vector, [\(u\) \(v\) \(w\)], must be parallel to the lattice plane, (\(h\) \(k\) \(l\)). Thus, the following condition must be satisfied: \begin {equation} \label {head:eqn_hukvlw_1} hu + kv + lw = 0 . \end {equation}
The type of the first vector is set by a pull down menu (Fig. 7.1, d, g). If a vector of the current layer is parallel to that of the reference layer, select \(\parallel \) in the pull down menu (Fig. 7.1, f). If the two vectors are perpendicular to each other, select \(\perp \) in the pull down menu. Then input indices in text boxes (Fig. 7.1, h).
7.3 Examples
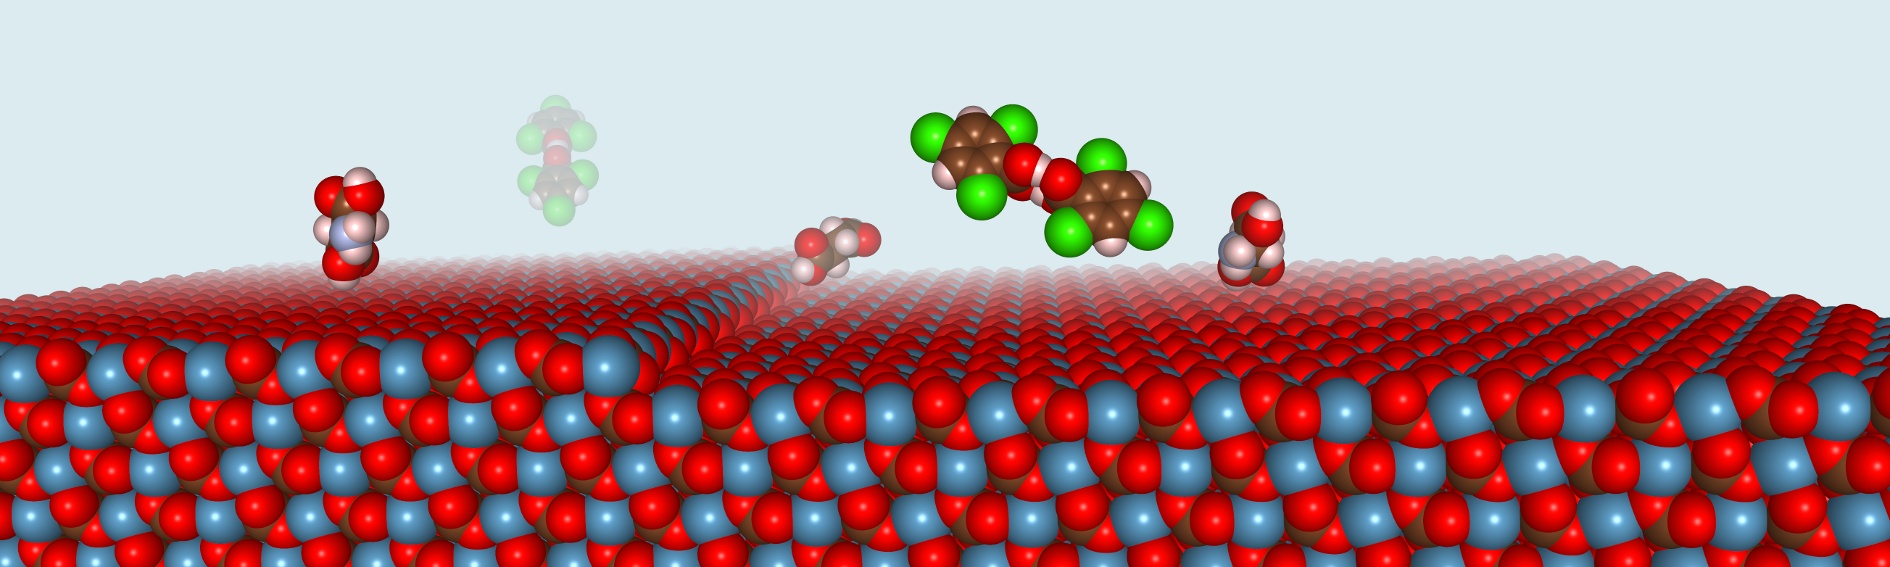
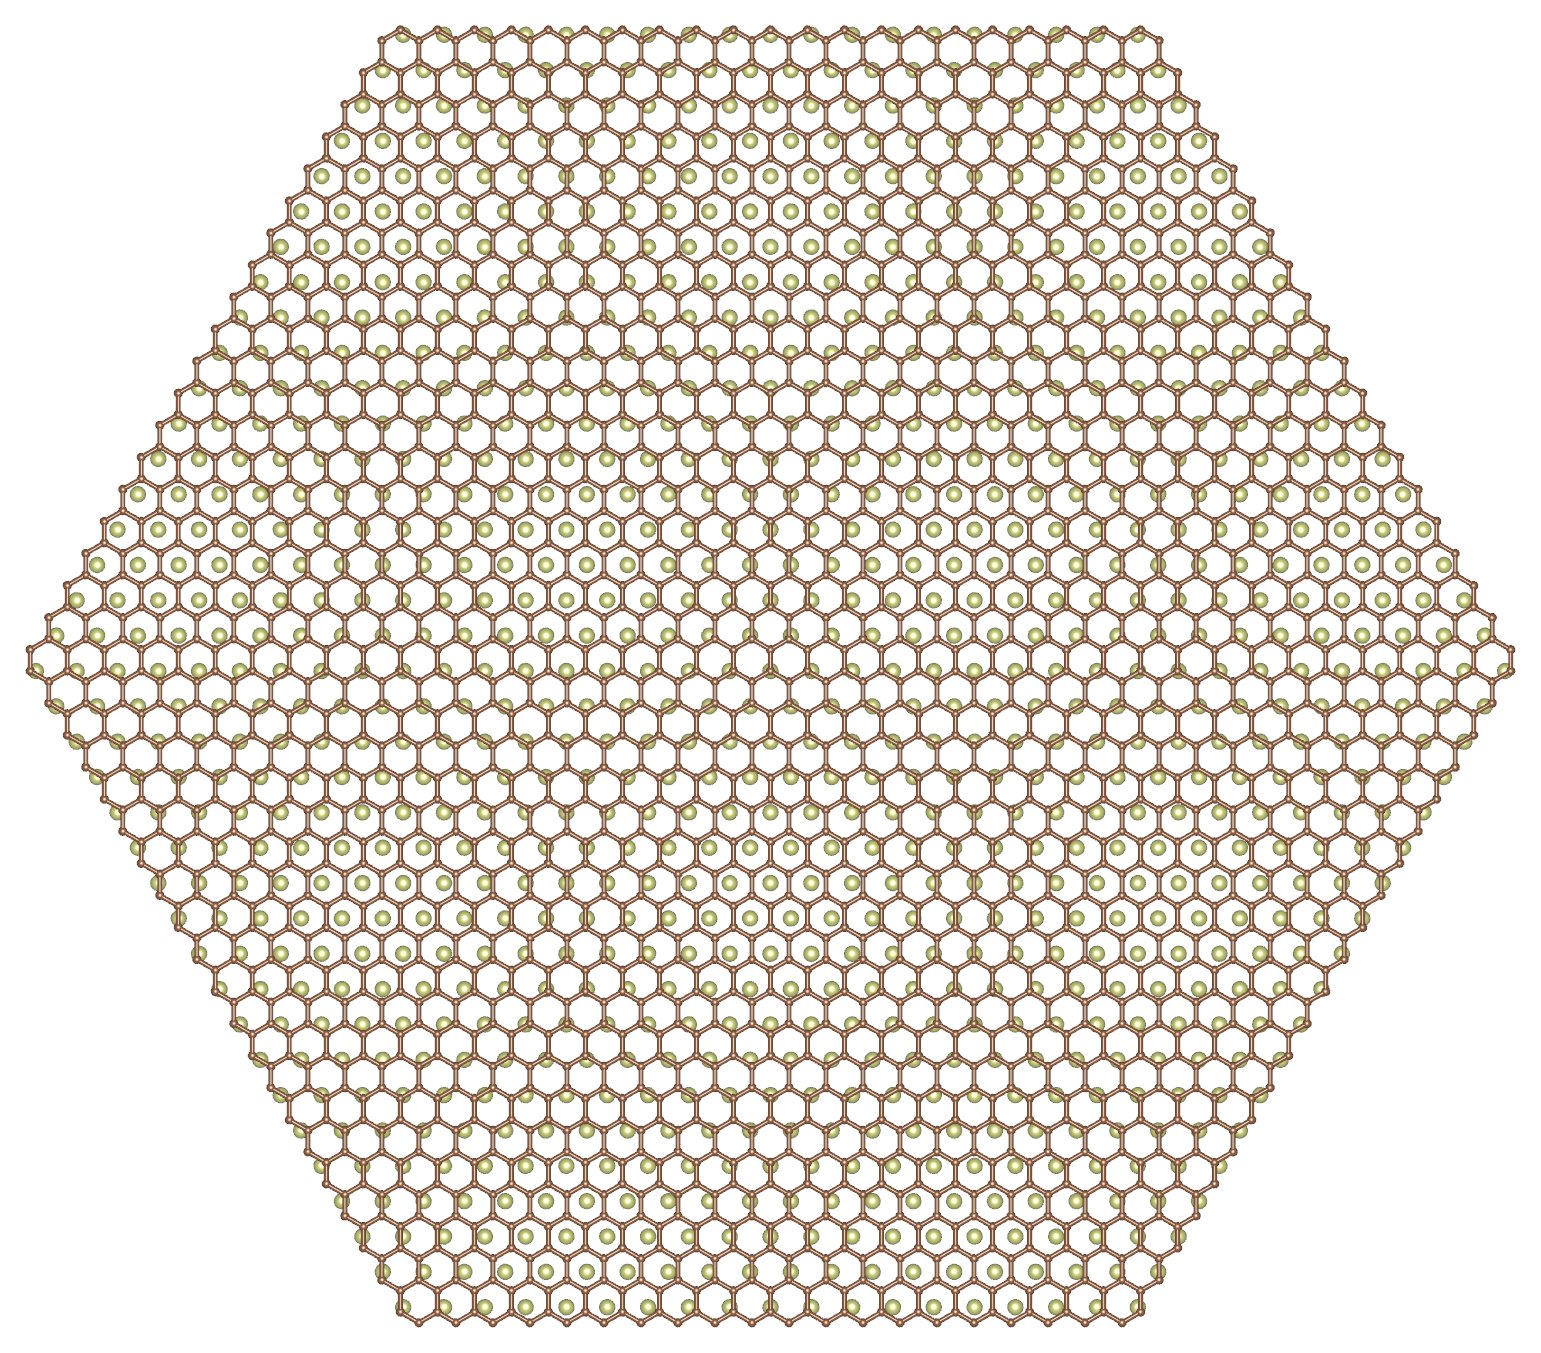
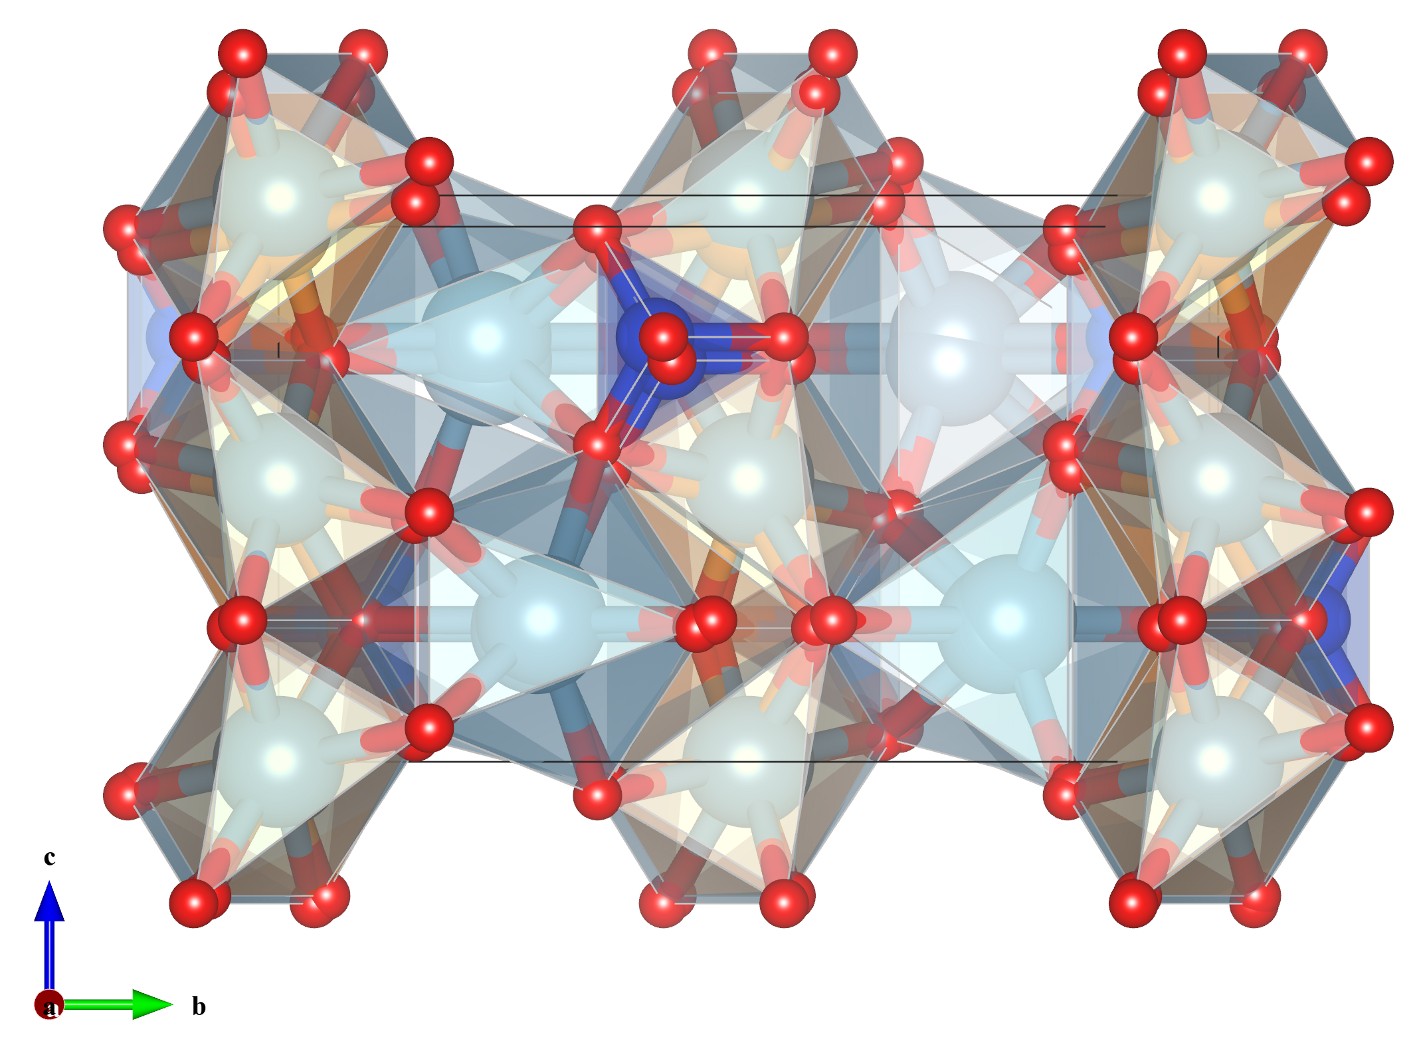
Figure 7.2 shows two kinds of organic molecules approaching a surface of calcite-type CaCO\(_3\). Figure 7.3 illustrates graphene on a (111) surface of Ir [59]. An example of overlaying isosturactural crystals is displayed in Fig. 7.4.